
Data Viz Competition: Mother & Daughter Team
This is a very exciting blog post for me, because I’ve just completed a project where I was able to combine three of my favorite things:
Teaching people about data
Spending time with my family
Being involved in the women in data community
Yesterday my 8 year old daughter and I submitted an entry into the Women in Analytics Data Viz Competition!
About the Project
A picture of the final poster by Juliette and Laura Ellis
Juliette is a Pokémon enthusiast and I am passionate about gaining insight from data. We decided to combine our interests and see if we could use data visualizations to boost Pokémon battle outcome predictions. We began the task by having Juliette select 6 battles to evaluate.
The Data
We based our analysis on the Kaggle Pokémon dataset as well as the Super Deluxe Essential Handbook (Pokémon). Searching for data was not a problem because Emily Robinson had previously pointed it out in a different thread about kids and data.
Exploration

We explored the data sets together. I navigated the data and performed the operations of trying out different data visualizations. Juliette acted as the SME, explaining core concepts and column definitions. For example; I thought that the ‘against_x’ variables were showing the Pokémon strength against various powers, when in fact it was showing their weakness.
While the final radar chart grids were made in excel, we had a great time exploring the data using rawgraphs.io to drag and drop different charting options together.
Creating the Scorecards
We brainstormed on the design of an impactful scorecard and decided that it required a mix of images, graphs and written context. After mocking up several graphs, we chose bar and radar graphs. Juliette was excited to create comparative, multiplayer radar graphs that she wishes were included in the Pokémon Let’s Go game.
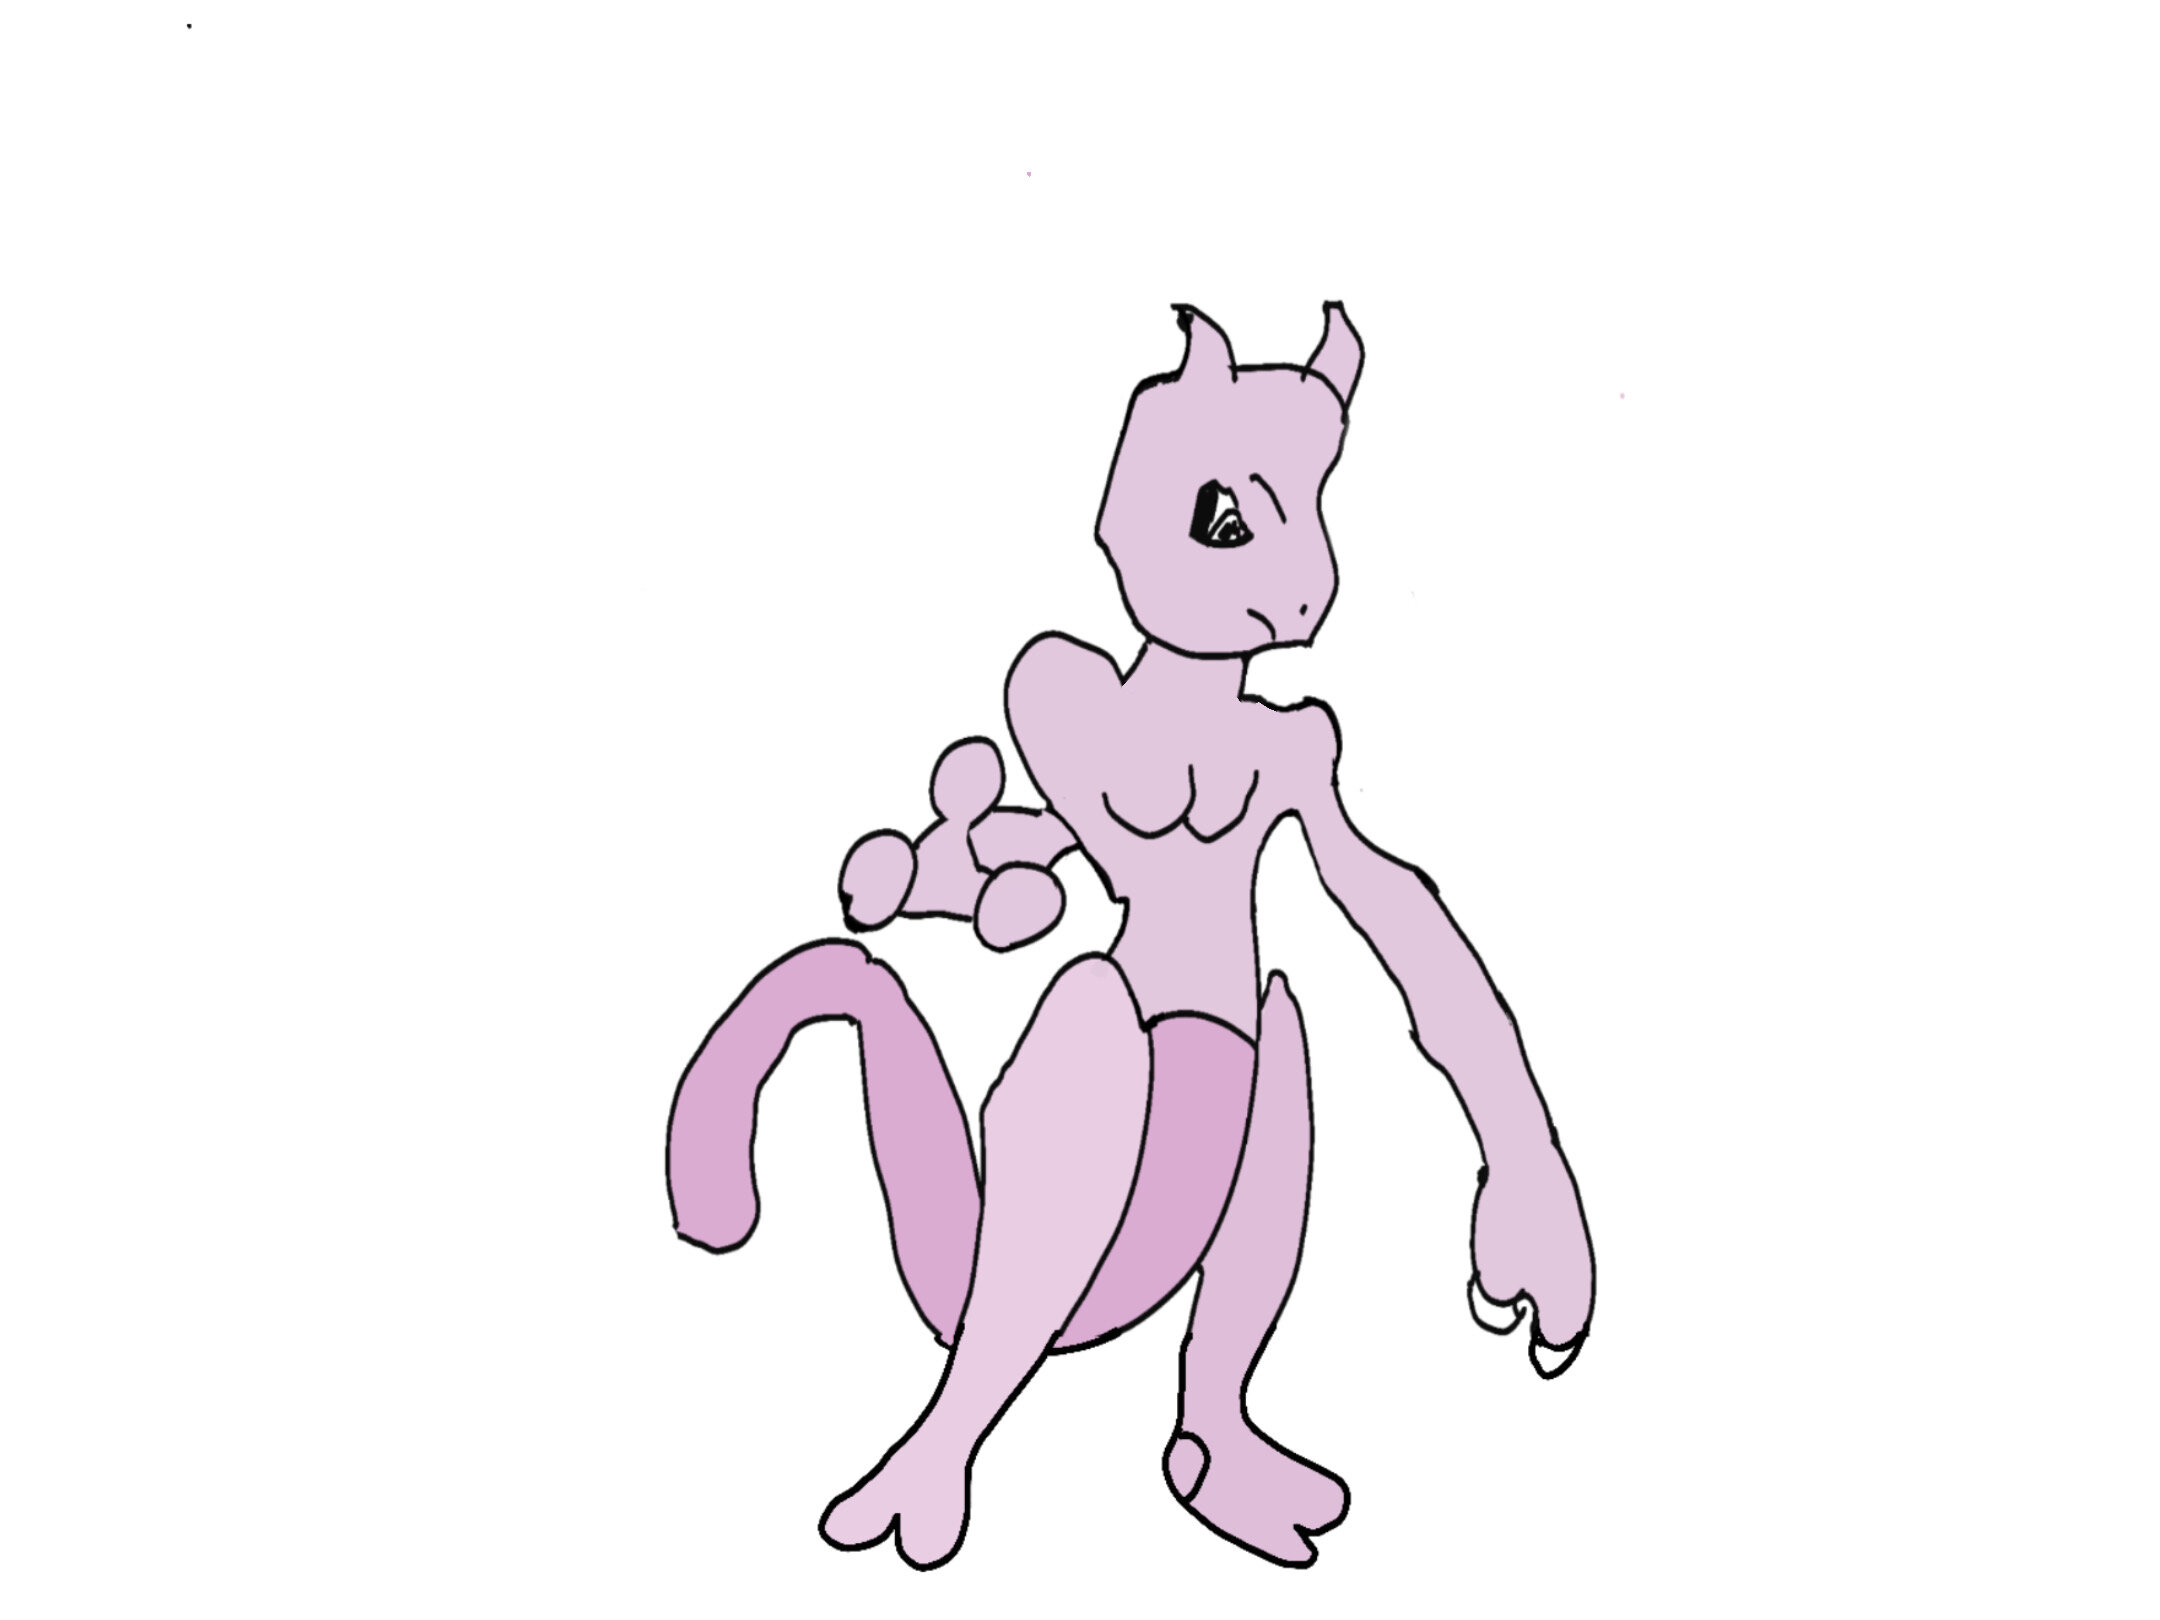
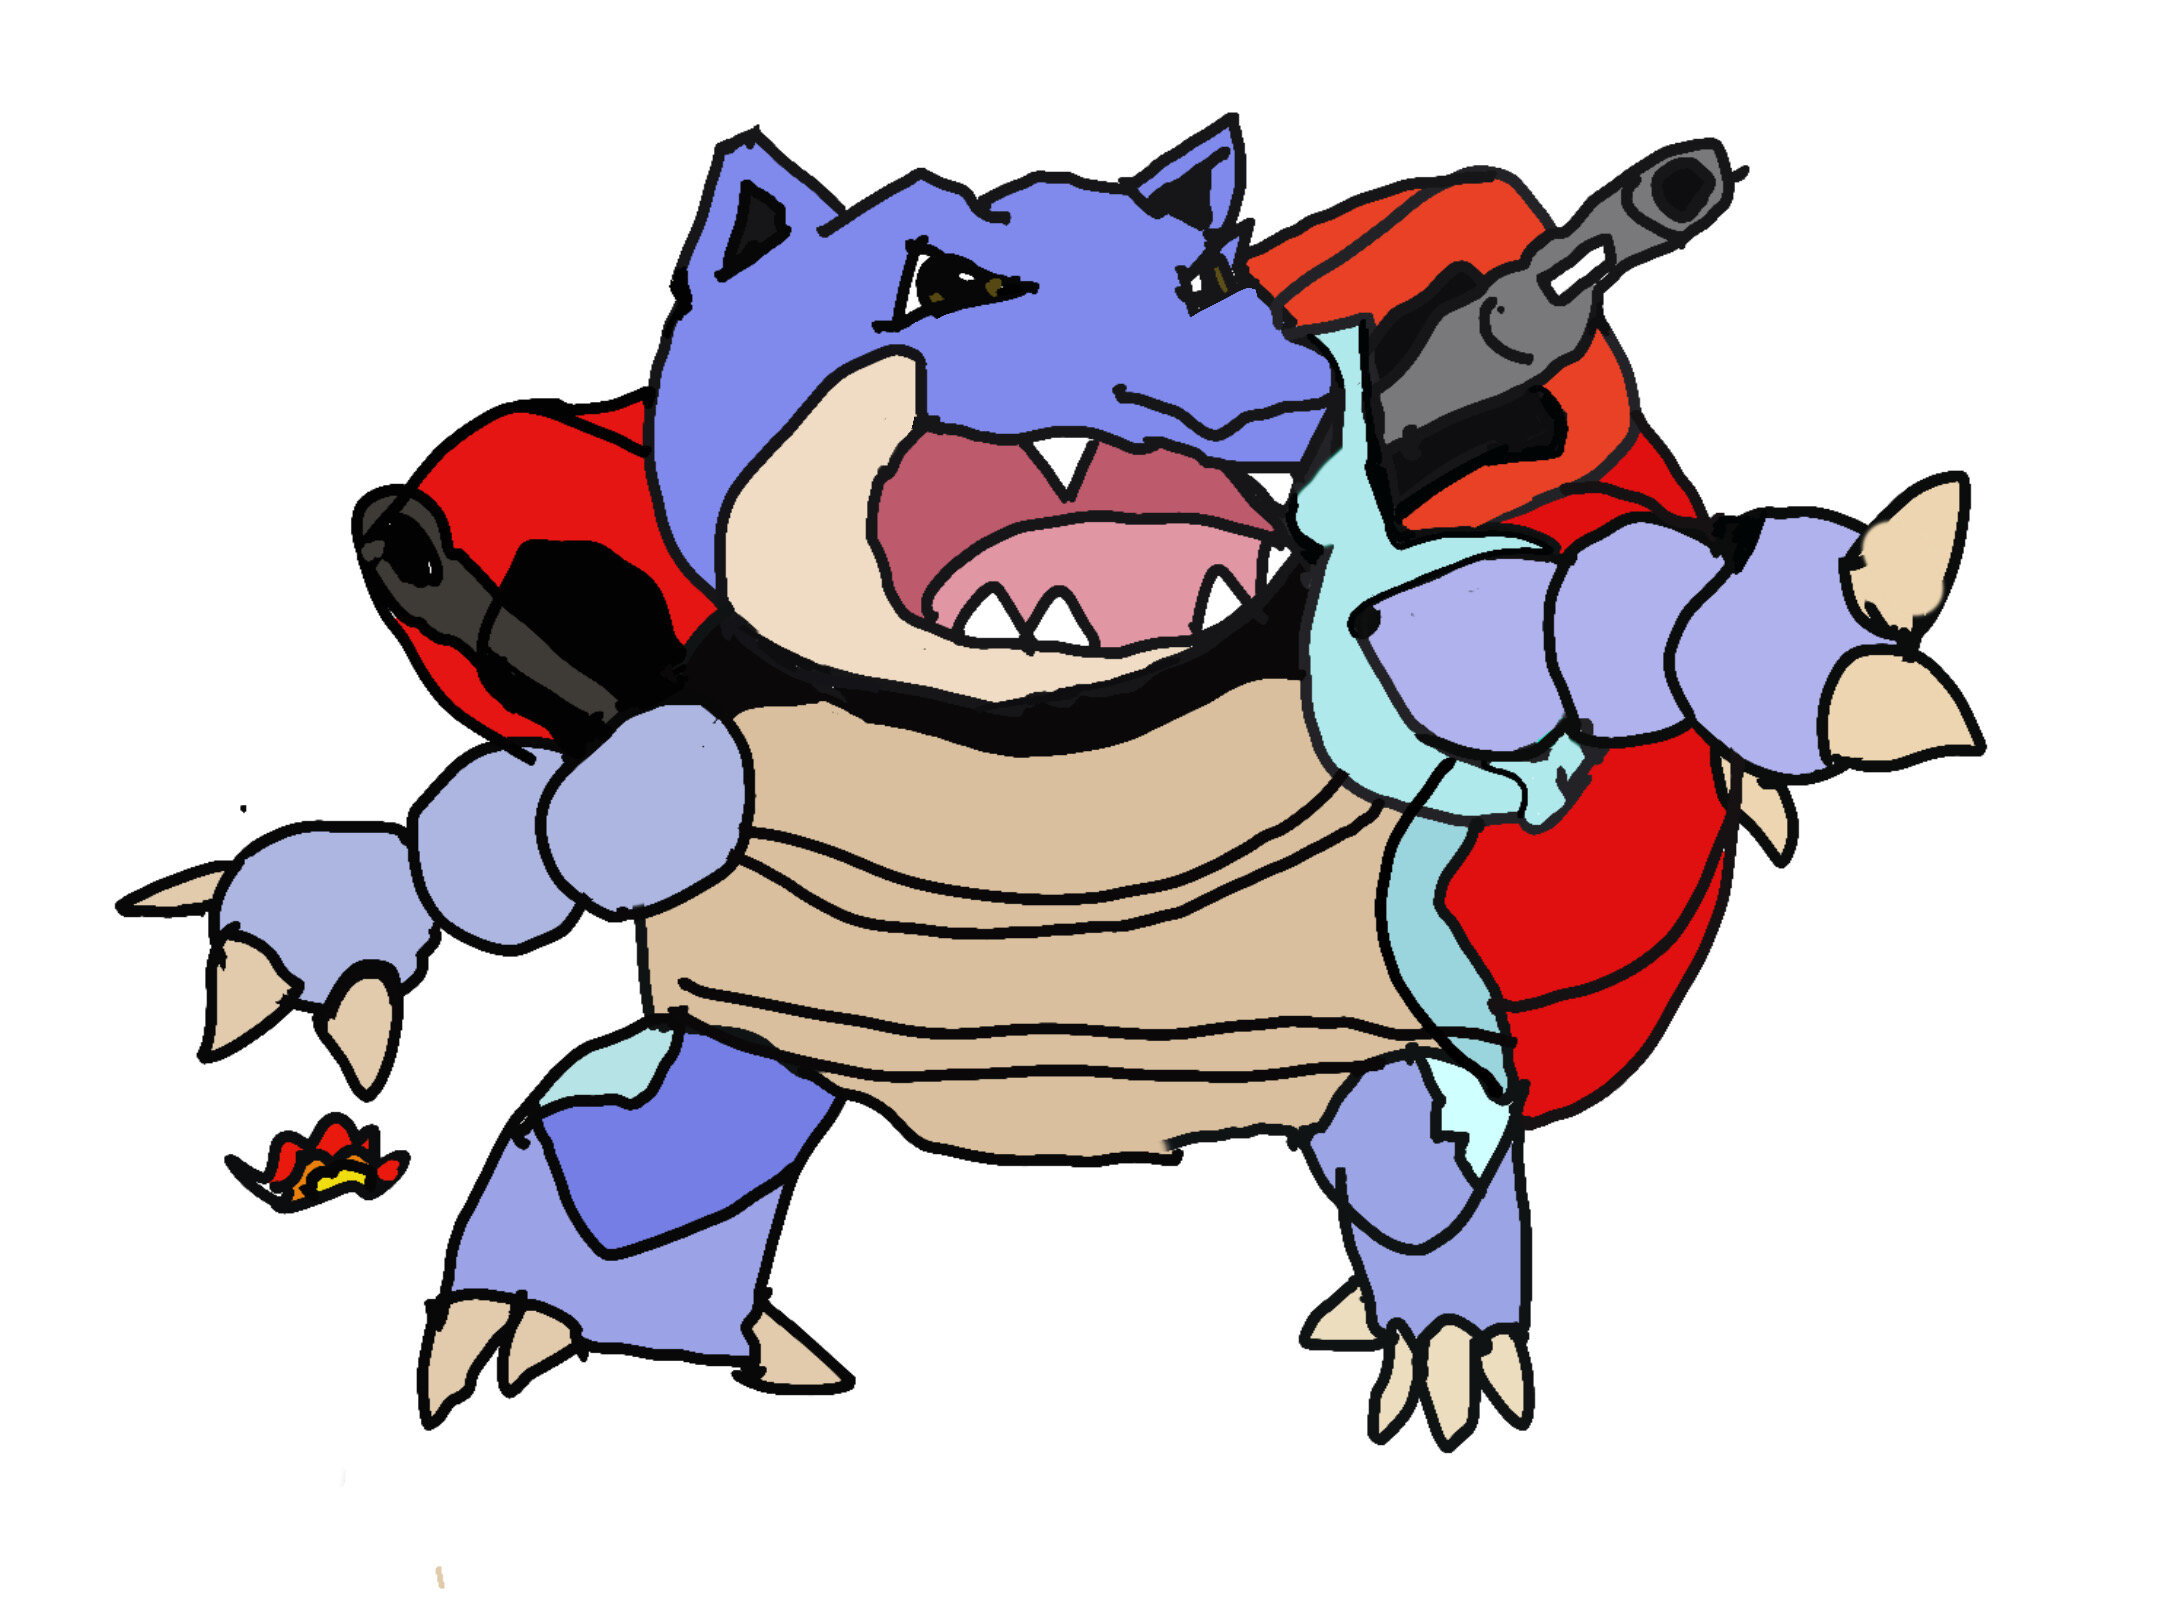
The Illustrations

A time lapse replay of Juliette’s Blastoise drawing created in Procreate, a digital illustration application.
Juliette created the Pokémon character drawings using Procreate, a digital illustration app that my brother Paul Hammond introduced us to. For anyone looking to get better with drawing, or even just looking for a hobby, I highly recommend this app!
In the end she created seven illustrations total including 6 Pokémon characters and a Pokéball.


The Scorecards

Screenshot of Pokémon Let’s Go stats
The scorecards included a radar graph plotting the Pokémon characters relative performance in hit points, attack, defense, speed, special defense and special attack. There is a visualization similar to this in the Pokémon Let’s Go game, but it doesn’t show two characters on the same grid, which makes it difficult to compare characters.
The bar charts and scorecards were compiled in keynote. The radar graphs grids were created in Excel. The scorecards and radar graphs were printed using full page shipping labels to make it easy to apply to the poster board. The physical portion of the radar graphs were created with the printed grid, rainbow loom elastics and push pins. I had to use a bit of hot glue to keep the push pins stable.
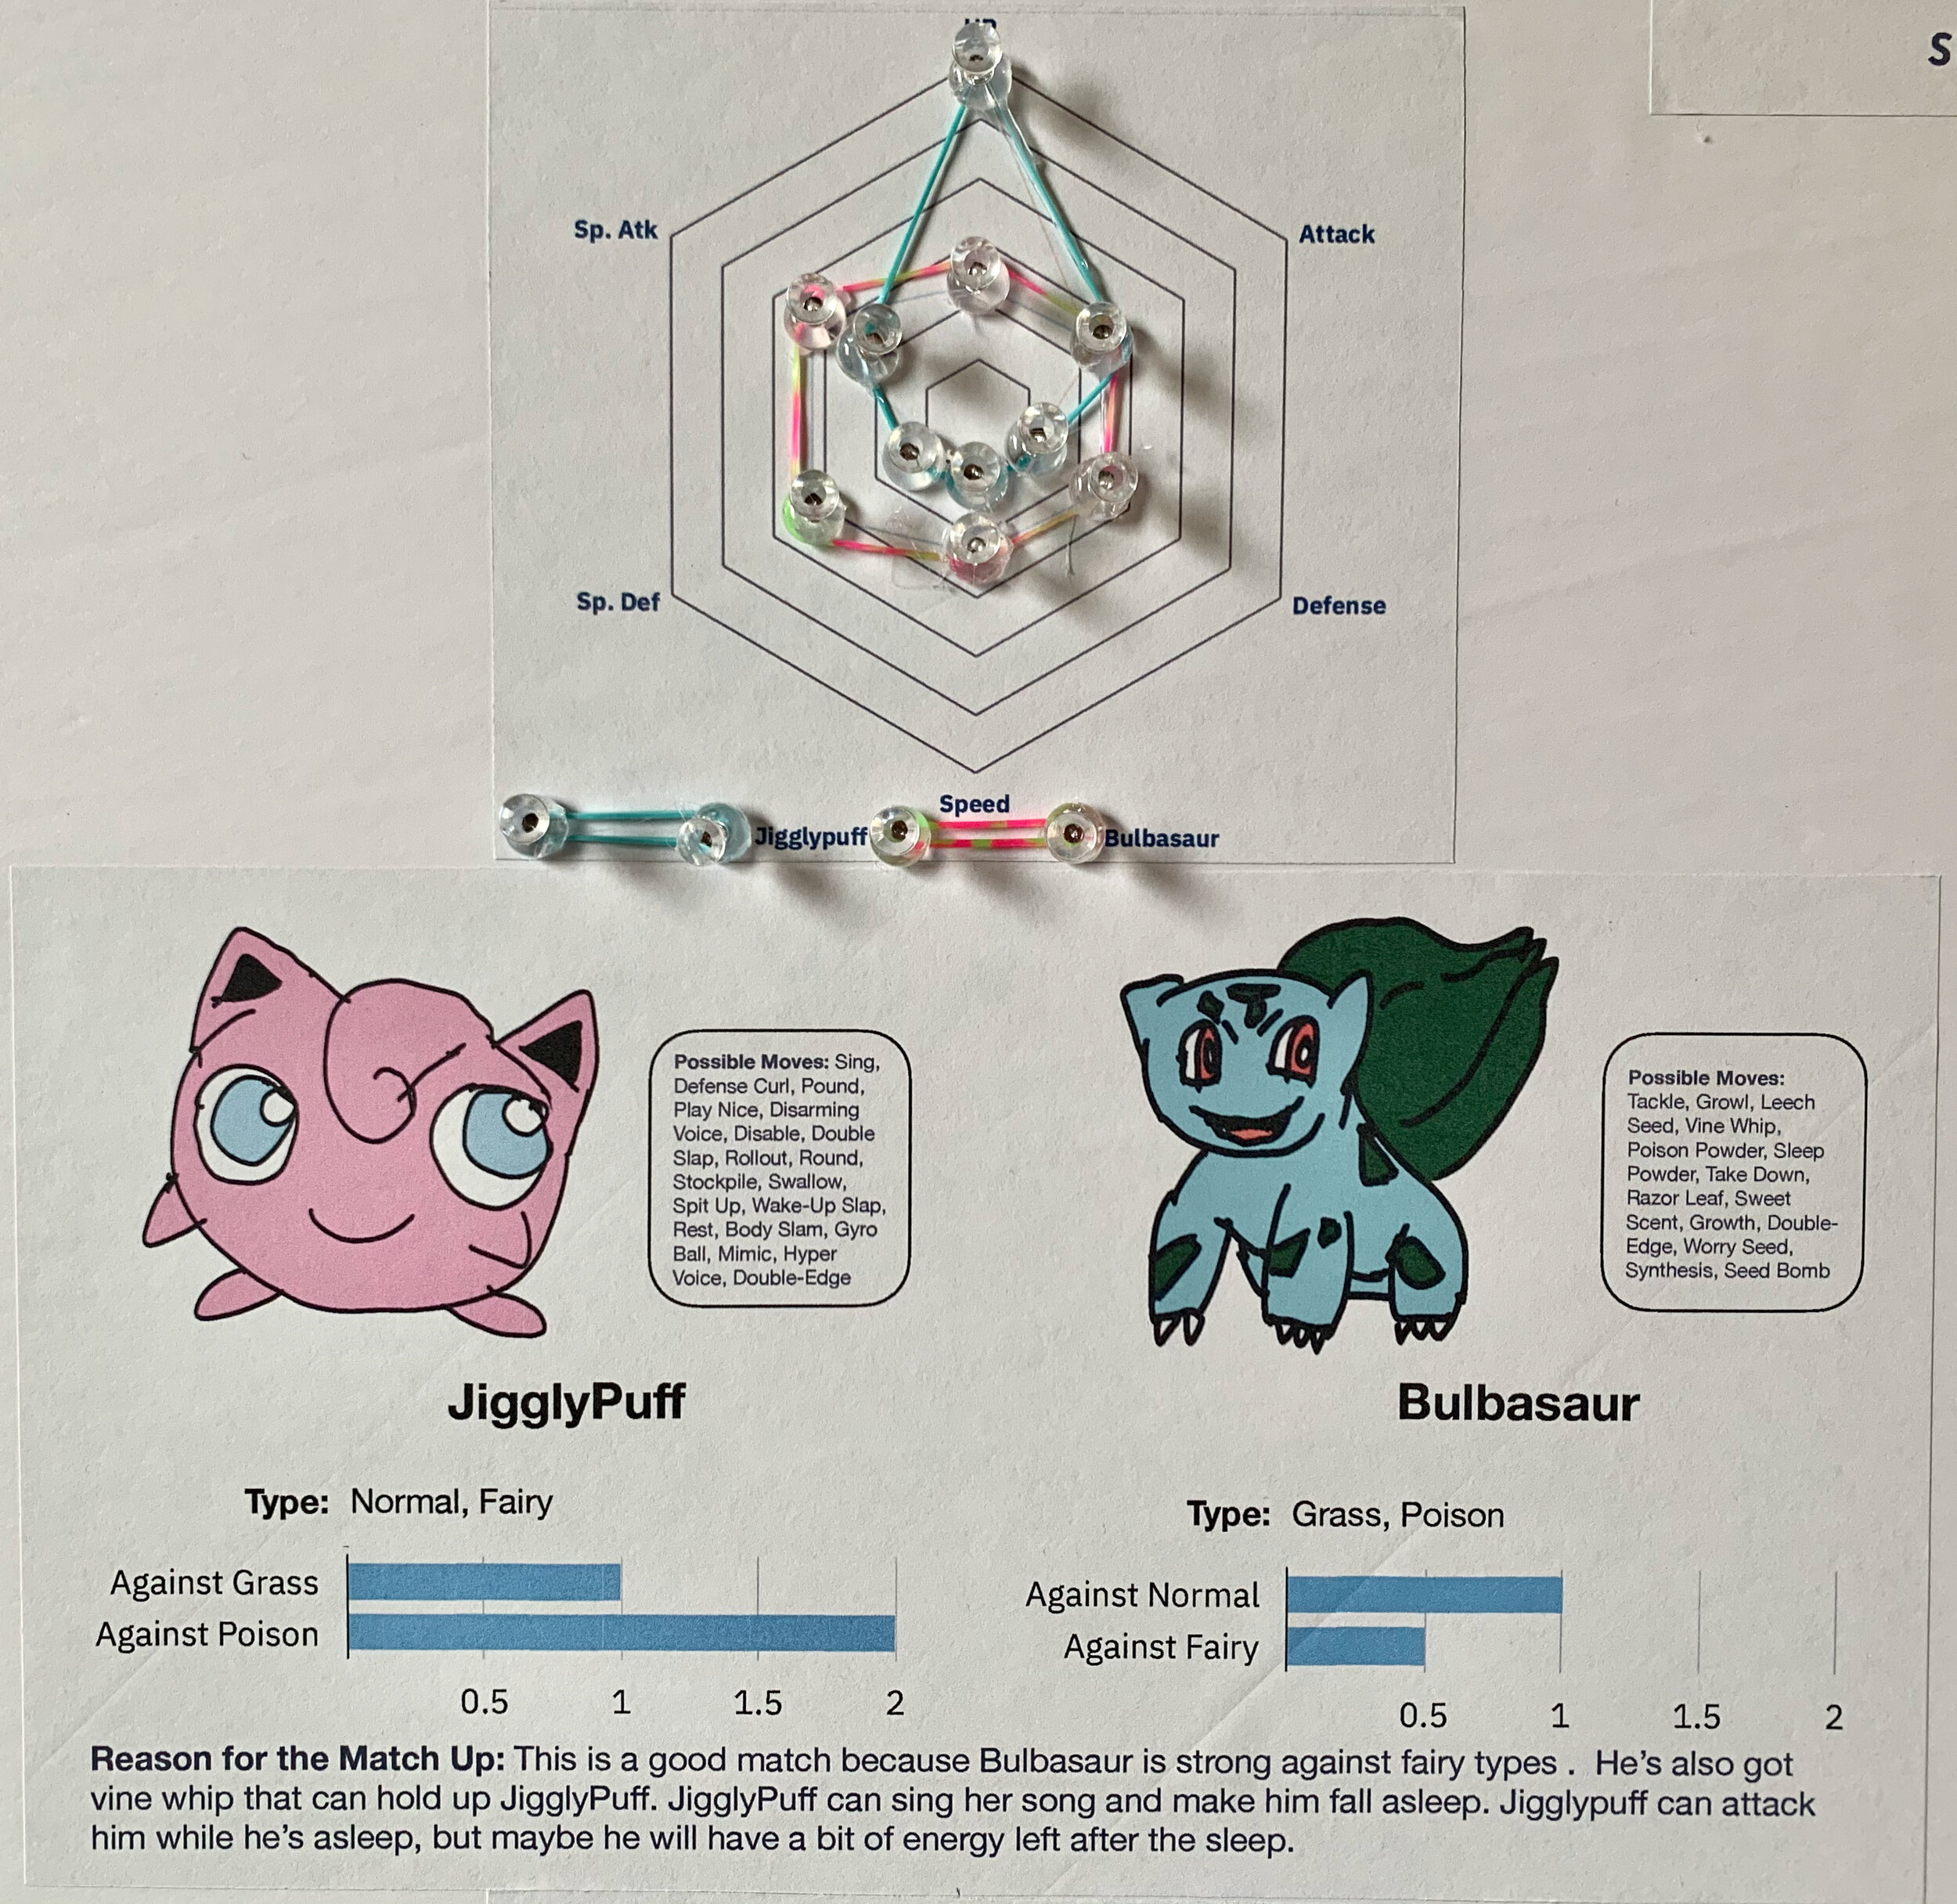
An example Pokémon battle scorecard.
Thank You For Reading

Juliette and I posing for a picture with the final poster!
Both Juliette and I deem the project to be a success. The scorecards helped Juliette to re-evaluate and better predict Pokémon battle outcomes. And, as a result of the project, Juliette learned about the power of data visualization.
I learned a ton about Pokémon in general and specifically how Pokémon characteristics can impact battle performance. She is delighted with my new understanding of her hobby.
Update
Since submitting the entry and posting this, I upgraded my phone to an iPhone 12 with the LiDAR feature. With this cool new feature, I was able to take a 3D model of the final poster. Check it out below!


