
At Home Data Activities for Young Kids
My husband and I have just completed week two of quarantine life working from home with our 4 and 7 year old daughters. We know that we will not provide a homeschool curriculum, and we definitely can’t match the amazing program planning done by our childrens regular teachers. But to get through these times sane and healthy, we are looking for fun activities to do with the kids which motivate them to create or learn.
At Home Graph Week!
As a data nerd myself, I knew this was my chance to get them hooked on data. Over the past week I took them through a series of small videos and activities to introduce them to some data gathering and visualization topics. We tackled sorting and comparing, bar graphs of various forms, tallying, and pie charts. Despite the usual sibling squabbles, the kids ended up loving it and now our graphs are proudly displayed all over our home. With an abundance of great online resources, it was relatively easy to do. I am sharing our kid-focused data projects in hopes that others may have a bit of data fun with their kiddos as well. Enjoy!
Day 1 - Sorting & Stacking

Introduction to sorting with Curious George - A short, 2 minute video showing kids how it’s easier to work with a lot of items if you sort them.
Activity


Gather a bunch of legos of the same dimensions and a variety of colors. Mix them up and put them in a pile.
Ask your kids some questions about the legos. For example “Without counting, which lego color do you think has the most legos?” etc.
Ask your kids, how they might be sure that these guesses are right, and if they learned anything they can use from the Curious George video.
Create the stacks of legos and put them in order of height.
Day 2 - Data Observations, Sorting & Bar Charts
Learn

Introduction to bar charts with the Curious George Hat Grab Game

Introduction to bar charts with Peg + Cat
Curious George Hat Grab Game - A really fun game that the kids loved, which bridges the concepts of sorting to bar graphs.
Introduction to Bar Charts with Peg + Cat - A short, 2 minute video showing how to use bar charts to compare results.
Activity
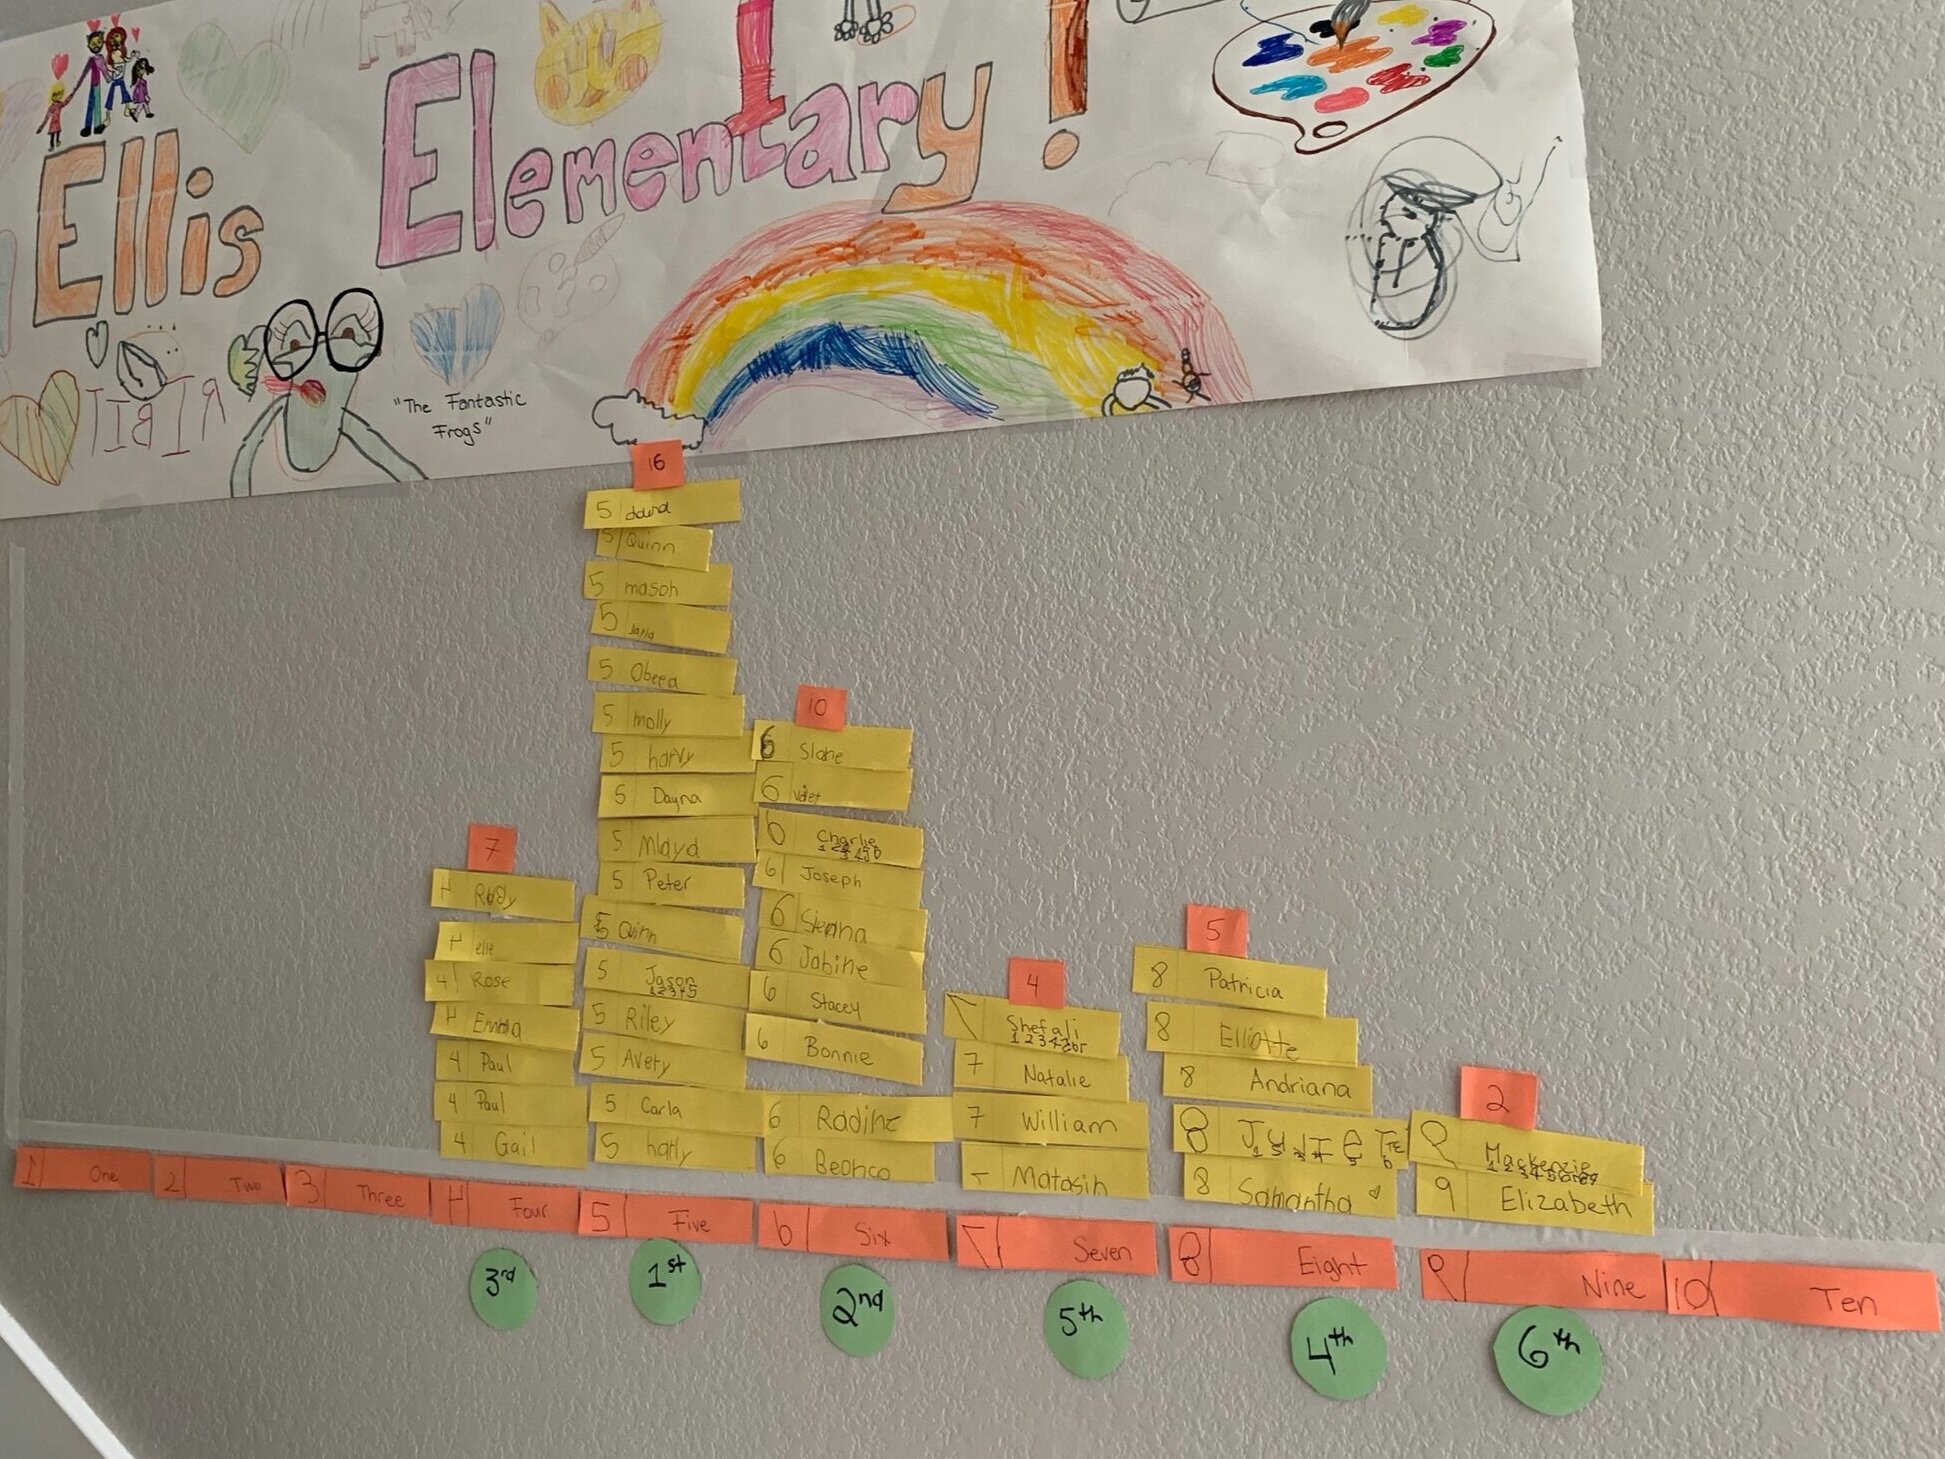
I’ve seen a lot of variations of using the number of letters in a child’s name to introduce bar charts for kids. Comprehensive write ups can be seen at these resource sites:
The premise is that:
Childrens’ names are the data points or observations. Typically, in the classroom, they use all the students in the class. Since we are stuck at home, we just listed the names of some classmates, family members, and of other people we know.
The number of letters in the name is counted for each observation.
The names are stacked on a chart by the total number of letters.
The end result turns out to be a bar chart showing the distribution of total letters in all the names.
The kids LOVED this activity. Of course, the big seller was that they were allowed to tape a whole bunch of stuff to the wall - so remember to use paint-friendly masking tape or painting tape! They were super proud to see where their name fit into the bar chart and they were excited to call friends and relatives to inform them where they fit as well!
Day 3 - Tallying and Bar Charts
Learn

Introduction to tallying and bar charts with a youtube video

Introduction to the fun and games of tallying with Tally O’Mally and Tally Cat Keeps Track
Introduction to Tallying and Bar Charts - I found it difficult to find a video that concretely and easily explains the basics of bar charts for kids under 8 years. I think this youtube video did a great job of keeping the concepts simple but explaining the basics of how to create and interpret bar charts.
Introduction to The Fun and Games of Tallying - We have two books which do a great job showing the fun with tallying. I highly recommend these books! However, if you can’t get your hands on them, don’t worry; there are videos on youtube which verbalize the concepts and show all the pictures.
Tally O’Mally is all about fun family competition and tallying up observations in different categories. If you can’t get the physical book, watch someone read it online.
Tally Cat Keeps Track also showcases some healthy competition by using tallying to understand relative values. If you can’t get the physical book, watch someone read it online.
Activity


After learning all about tallying and friendly competition, ask the kids if there is something that they would like to tally around the house. We decided to break up into teams: kids vs parents, naturally! In our case wanted to see which team had more yellow and pink items around the house.
We went around the house and found every item with any pink or yellow. We added a tally mark to the team the item belonged to.
After my 7 year-old tallied the totals, we then plotted the results on a big bar graph. Based on the previous videos, both kids were able to point out where approximately the bar line should rise to.
Day 4 - Pie Charts

Introduction to Pie Charts with Odd Squad - Odd Squad is such a cute and educational show. In this episode they are throwing a surprise party and they need to decide what flavor the cake should be. They are making the decision by visualizing what flavor of cake everyone likes the best.

Create an empty pie chart split into 8 equal parts.
Have all kids pick different colored crayon or pencil crayon.
Have the kids play rock-paper-scissors and every time someone wins, they get to fill in a piece of the pie with their chosen color.
Play the game a few rounds and see who can fill in the most parts of the pie.
Thank You
Thanks for following along with our first attempt at graph week in the Ellis household. What I have shared are just fun activities for the home and are not meant to be a replacement for any of the curriculum that our children’s dilligent teachers prepare on a daily basis.
We had a lot of fun this week playing around with data and data visualization. If you end up trying any of these activities please let me know by commenting below or reaching out to me on twitter!


